Inventory data reduces inventory costs for veterinary hospitals by breaking cost of goods sold down item by item: which drugs and supplies drive spend, who uses them, and where. With that view, hospitals can cut excess stock and expired product, find items that were used but never billed, and set reorder points from actual usage instead of habit.
Why doesn't the COGS total tell the whole story?
Cost of goods sold (COGS) is what a hospital pays for the products it sells and uses. That includes medications dispensed to clients and the supplies consumed while delivering care, like vaccines, gauze, and antiseptics. Research in the Canadian Veterinary Journal found cost of goods is the highest expense in mixed-animal practices and the second highest in companion-animal practices.
The COGS total answers one question: how much did the hospital spend? It doesn't say which items drove the spend, who used them, where, or whether they were billed. When those costs sit in one bucket, a rise in COGS is hard to trace.
Two departments can bring in similar revenue and consume very different amounts of product. One high-volume item can take a growing share of purchasing. One slow item can sit on the shelf until it expires. Item-level data separates those stories.
What counts as inventory data?
Inventory data is the record of every item a hospital buys and uses. A purchase order shows what the hospital bought and what it paid. Item-level usage data shows what happened after the product arrived.
Each dispense can record:
- The item and the quantity
- The date and time
- The user
- The patient or invoice
- The department or location
- The on-hand count after the transaction
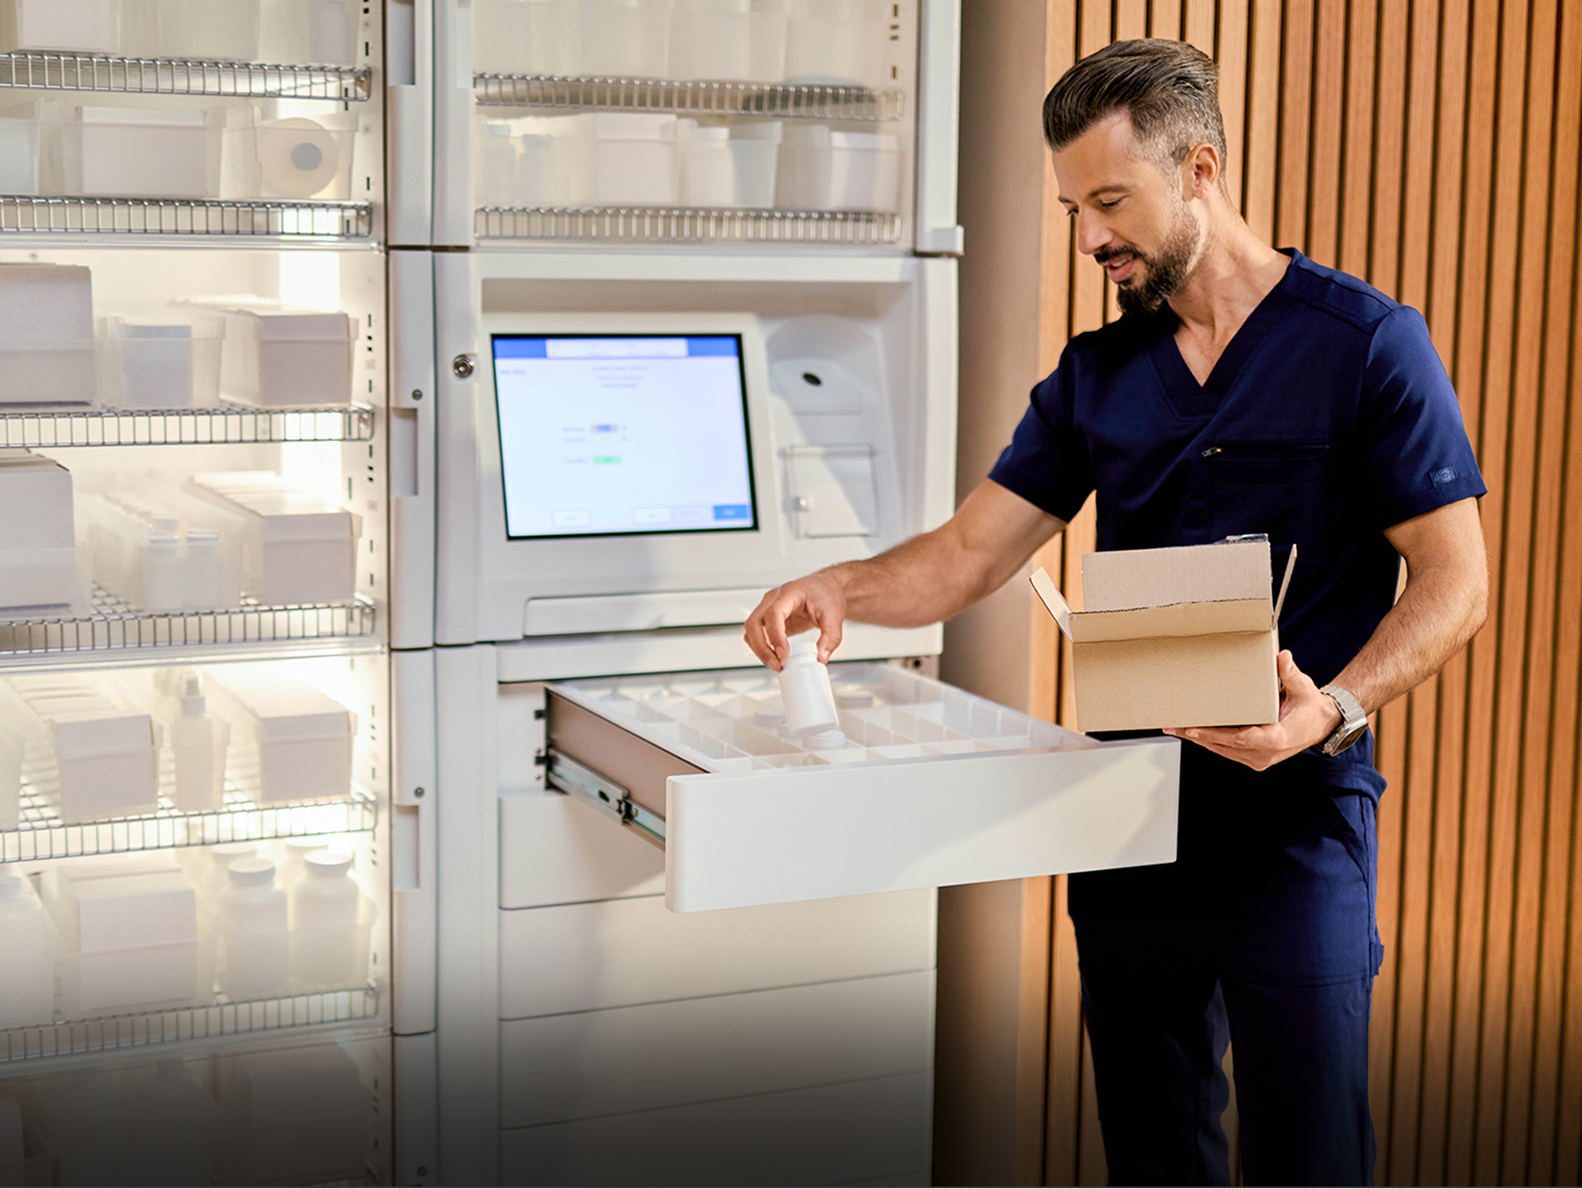
The data is only as good as the capture. If staff write the transaction down after the fact, the record has gaps. Cubex records the transaction as part of the dispense: the smart cabinet controls access, and the platform logs who took what, when, and for which patient. The record is a byproduct of the work instead of a second task after it.
How does inventory data show where costs go?
Which drugs and supplies drive spend?
Start at the item level, not total spend. Going item by item answers five questions:
- Which items take the largest share of spending?
- Which items are used most often?
- Do purchase quantities match consumption?
- Which items move slower than expected?
- Which items keep approaching expiration?
If one item's share of monthly purchasing keeps growing, item-level data shows why: usage went up, purchase quantities changed, unit cost rose, or stock is building faster than it's used. The same view flags slow movers. If purchasing holds steady while usage falls, working capital is sitting on the shelf.
High-volume supplies matter too. They rarely need the access control a medication does, but they carry real cost. Cubex supply management extends tracking to open shelves and stockrooms, with the Flex and Buddy recording usage and triggering reorders.
Who is using which items?
When each dispense is tied to a user, leaders can compare usage across doctors and team members. A difference is not a verdict. Caseload, procedure mix, and patient needs all change what someone uses.
User-level data is a starting point for better questions. If one user consistently records different usage of an item, leadership can look at the context. It may be case mix. It may be a workflow worth reviewing.
Which departments and service lines consume the most?
Surgery, dentistry, emergency, and general appointments each use different products. Revenue alone doesn't show how much inventory each one consumes.
Where the data supports it, leaders can ask:
- Which departments consume the most inventory?
- Which service lines rely on the highest-cost items?
- Are inventory costs rising faster than the revenue they support?
- Do stocking decisions match each department's actual demand?
Multi-location groups can run the same comparison across hospitals: purchasing, usage, turnover, and workflow side by side. Enterprise inventory management covers how connected data supports benchmarking across a group.
Where do hospitals lose money on inventory?
Collecting data is not the goal. Using it to find margin leaks is.
Excess inventory, expiration, and waste
Inventory on the shelf is cash already spent. Some buffer is necessary. Carrying more than the hospital will use raises holding costs and expiration risk. Product that expires before use is the clearest loss: the hospital paid for it and got nothing back.
Usage data shows which items are piling up faster than they're used. Comparing what you use with what you buy leads to better reorder quantities and timing. The goal is not the lowest possible stock. It's stock that matches demand. For the carrying cost math, see what it really costs to hold inventory.
Inventory variance and missed charges
Physical and recorded counts don't always match. Unrecorded waste, wrong quantities, incomplete documentation, misplaced product, or an item used without a transaction can all cause a variance. The data doesn't prove the cause. Repeated discrepancies show where to look.
Missed charges are a separate leak. When an item is used for a patient but never reaches the invoice, the hospital absorbs the cost and loses the charge. Connecting the dispense to the invoice in the practice management system removes the manual step where charges slip. Cubex software captures charges and automates reordering, and CubexConnect links inventory activity to the systems hospitals already use. More on that in why charge capture matters.
How do hospitals turn inventory data into better decisions?
The data is worth what the hospital changes because of it.
Purchasing from actual usage
Historical usage is a better basis for purchasing than habit. Fast movers may need a different ordering strategy. Items that keep piling up may need lower reorder points or smaller orders. Past usage won't predict the future perfectly: caseload, season, pricing, and service mix all shift demand. It gives buyers evidence to weigh alongside those factors.
A peer-reviewed article in Veterinary Clinics of North America: Small Animal Practice names efficient use of inventory, people, systems, and processes as levers for practice efficiency and profitability.
Pricing and budgeting with cost data
Cost data adds context to pricing. A service line can post strong revenue while consuming far more drug and supply spend than expected. Revenue alone makes it look productive. Inventory cost completes the picture. Pricing still depends on labor, overhead, equipment, and the market. Inventory data clarifies one part of it.
Budgeting improves the same way. Instead of projecting next year from one hospital-wide COGS figure, leaders can project from usage by item, department, or location. That separates broad price increases from changes in one area.
Where should a hospital start?
Start with visibility. Pick the category of inventory with the most spend or the most variance, capture every transaction at the point of use, and review the data on a set schedule.
Cubex is an automated inventory management platform for veterinary hospitals. It records each dispense as it happens and connects that record to billing and reordering, so COGS becomes something leaders can investigate, not just a line on the P&L.
Frequently asked questions
What is COGS in a veterinary hospital?
Cost of goods sold is what a hospital pays for the products it sells or uses in care: medications dispensed to clients plus supplies consumed during treatment. It is one of the largest expenses in a veterinary hospital.
How often should a veterinary hospital review inventory data?
Match the cadence to the item. High-cost items and items with recurring variances warrant the most frequent review. Slow-moving supplies can be reviewed less often. With real-time data, the review becomes a check on trends rather than a recount.
How can a hospital tell if it's carrying too much inventory?
Compare purchasing with consumption by item. Purchases that consistently outpace usage, items approaching expiration before they're used, and items that sit untouched for long stretches all point to excess stock.
What causes differences between recorded and physical inventory counts?
Common causes include unrecorded waste, wrong quantities, incomplete documentation, misplaced product, and items used without a transaction. Capturing the transaction at the point of use reduces the manual steps where these gaps start.
How does inventory data help with budgeting?
It lets leaders build next year's budget from usage by item, department, or location instead of one hospital-wide COGS figure. That separates broad price increases from changes concentrated in one area.
Sources
- Canadian Veterinary Journal, PMC5731403
- Veterinary Clinics of North America: Small Animal Practice, PubMed 38042711
About CUBEX
CUBEX is an automated inventory management platform for veterinary hospitals. Combining secure smart devices with purpose-built software, CUBEX tracks every dispense in real time, supports controlled substance compliance, reduces waste and stockouts, and streamlines replenishment through connected workflows, including integrations with leading PIMS and supplier ordering platforms. The result is less manual work, better inventory control, and more time back for veterinary teams. Learn more →

Inventory data reduces inventory costs for veterinary hospitals by breaking cost of goods sold down item by item: which drugs and supplies drive spend, who uses them, and where. With that view, hospitals can cut excess stock and expired product, find items that were used but never billed, and set reorder points from actual usage instead of habit.
Why doesn't the COGS total tell the whole story?
Cost of goods sold (COGS) is what a hospital pays for the products it sells and uses. That includes medications dispensed to clients and the supplies consumed while delivering care, like vaccines, gauze, and antiseptics. Research in the Canadian Veterinary Journal found cost of goods is the highest expense in mixed-animal practices and the second highest in companion-animal practices.
The COGS total answers one question: how much did the hospital spend? It doesn't say which items drove the spend, who used them, where, or whether they were billed. When those costs sit in one bucket, a rise in COGS is hard to trace.
Two departments can bring in similar revenue and consume very different amounts of product. One high-volume item can take a growing share of purchasing. One slow item can sit on the shelf until it expires. Item-level data separates those stories.
What counts as inventory data?
Inventory data is the record of every item a hospital buys and uses. A purchase order shows what the hospital bought and what it paid. Item-level usage data shows what happened after the product arrived.
Each dispense can record:
- The item and the quantity
- The date and time
- The user
- The patient or invoice
- The department or location
- The on-hand count after the transaction
The data is only as good as the capture. If staff write the transaction down after the fact, the record has gaps. Cubex records the transaction as part of the dispense: the smart cabinet controls access, and the platform logs who took what, when, and for which patient. The record is a byproduct of the work instead of a second task after it.
How does inventory data show where costs go?
Which drugs and supplies drive spend?
Start at the item level, not total spend. Going item by item answers five questions:
- Which items take the largest share of spending?
- Which items are used most often?
- Do purchase quantities match consumption?
- Which items move slower than expected?
- Which items keep approaching expiration?
If one item's share of monthly purchasing keeps growing, item-level data shows why: usage went up, purchase quantities changed, unit cost rose, or stock is building faster than it's used. The same view flags slow movers. If purchasing holds steady while usage falls, working capital is sitting on the shelf.
High-volume supplies matter too. They rarely need the access control a medication does, but they carry real cost. Cubex supply management extends tracking to open shelves and stockrooms, with the Flex and Buddy recording usage and triggering reorders.
Who is using which items?
When each dispense is tied to a user, leaders can compare usage across doctors and team members. A difference is not a verdict. Caseload, procedure mix, and patient needs all change what someone uses.
User-level data is a starting point for better questions. If one user consistently records different usage of an item, leadership can look at the context. It may be case mix. It may be a workflow worth reviewing.
Which departments and service lines consume the most?
Surgery, dentistry, emergency, and general appointments each use different products. Revenue alone doesn't show how much inventory each one consumes.
Where the data supports it, leaders can ask:
- Which departments consume the most inventory?
- Which service lines rely on the highest-cost items?
- Are inventory costs rising faster than the revenue they support?
- Do stocking decisions match each department's actual demand?
Multi-location groups can run the same comparison across hospitals: purchasing, usage, turnover, and workflow side by side. Enterprise inventory management covers how connected data supports benchmarking across a group.
Where do hospitals lose money on inventory?
Collecting data is not the goal. Using it to find margin leaks is.
Excess inventory, expiration, and waste
Inventory on the shelf is cash already spent. Some buffer is necessary. Carrying more than the hospital will use raises holding costs and expiration risk. Product that expires before use is the clearest loss: the hospital paid for it and got nothing back.
Usage data shows which items are piling up faster than they're used. Comparing what you use with what you buy leads to better reorder quantities and timing. The goal is not the lowest possible stock. It's stock that matches demand. For the carrying cost math, see what it really costs to hold inventory.
Inventory variance and missed charges
Physical and recorded counts don't always match. Unrecorded waste, wrong quantities, incomplete documentation, misplaced product, or an item used without a transaction can all cause a variance. The data doesn't prove the cause. Repeated discrepancies show where to look.
Missed charges are a separate leak. When an item is used for a patient but never reaches the invoice, the hospital absorbs the cost and loses the charge. Connecting the dispense to the invoice in the practice management system removes the manual step where charges slip. Cubex software captures charges and automates reordering, and CubexConnect links inventory activity to the systems hospitals already use. More on that in why charge capture matters.
How do hospitals turn inventory data into better decisions?
The data is worth what the hospital changes because of it.
Purchasing from actual usage
Historical usage is a better basis for purchasing than habit. Fast movers may need a different ordering strategy. Items that keep piling up may need lower reorder points or smaller orders. Past usage won't predict the future perfectly: caseload, season, pricing, and service mix all shift demand. It gives buyers evidence to weigh alongside those factors.
A peer-reviewed article in Veterinary Clinics of North America: Small Animal Practice names efficient use of inventory, people, systems, and processes as levers for practice efficiency and profitability.
Pricing and budgeting with cost data
Cost data adds context to pricing. A service line can post strong revenue while consuming far more drug and supply spend than expected. Revenue alone makes it look productive. Inventory cost completes the picture. Pricing still depends on labor, overhead, equipment, and the market. Inventory data clarifies one part of it.
Budgeting improves the same way. Instead of projecting next year from one hospital-wide COGS figure, leaders can project from usage by item, department, or location. That separates broad price increases from changes in one area.
Where should a hospital start?
Start with visibility. Pick the category of inventory with the most spend or the most variance, capture every transaction at the point of use, and review the data on a set schedule.
Cubex is an automated inventory management platform for veterinary hospitals. It records each dispense as it happens and connects that record to billing and reordering, so COGS becomes something leaders can investigate, not just a line on the P&L.
Frequently asked questions
What is COGS in a veterinary hospital?
Cost of goods sold is what a hospital pays for the products it sells or uses in care: medications dispensed to clients plus supplies consumed during treatment. It is one of the largest expenses in a veterinary hospital.
How often should a veterinary hospital review inventory data?
Match the cadence to the item. High-cost items and items with recurring variances warrant the most frequent review. Slow-moving supplies can be reviewed less often. With real-time data, the review becomes a check on trends rather than a recount.
How can a hospital tell if it's carrying too much inventory?
Compare purchasing with consumption by item. Purchases that consistently outpace usage, items approaching expiration before they're used, and items that sit untouched for long stretches all point to excess stock.
What causes differences between recorded and physical inventory counts?
Common causes include unrecorded waste, wrong quantities, incomplete documentation, misplaced product, and items used without a transaction. Capturing the transaction at the point of use reduces the manual steps where these gaps start.
How does inventory data help with budgeting?
It lets leaders build next year's budget from usage by item, department, or location instead of one hospital-wide COGS figure. That separates broad price increases from changes concentrated in one area.
Sources
- Canadian Veterinary Journal, PMC5731403
- Veterinary Clinics of North America: Small Animal Practice, PubMed 38042711